A hands on look at what lives on the Kimberly sea floor

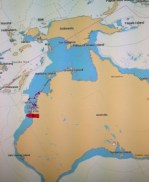
Welcome back! We are now on day 3 since arriving in the study area (Sunday 6 Dec 2015).  See where we are right now.

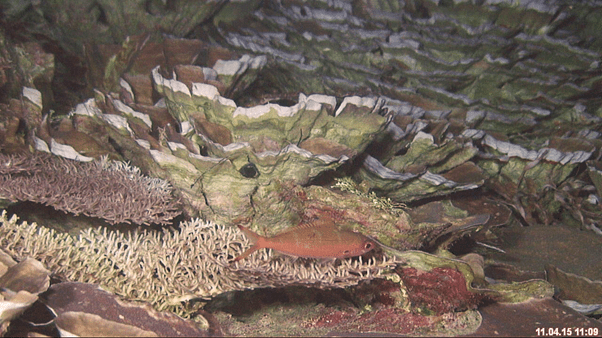
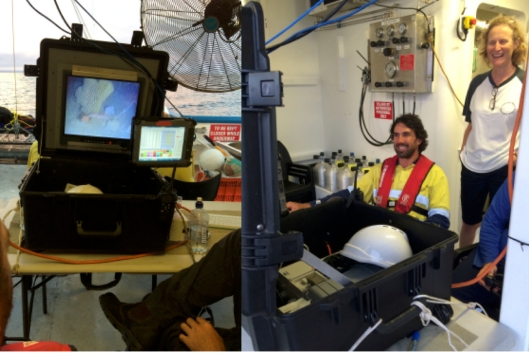
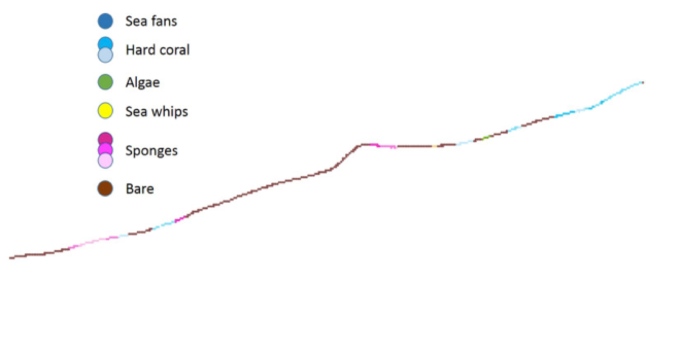
In my last blog, I showed you how we can see live video footage of creatures and habitat on the sea floor without even getting wet (using the Tow-vid system).

Sometimes, though, scientists need to see creatures first hand in order to understand more about them and where they live. For that reason, on this expedition we are also collecting samples of sea floor creatures for scientists from the Western Australian Museum and elsewhere to study.

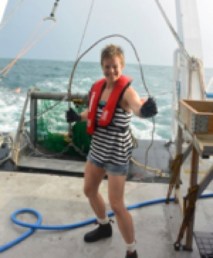
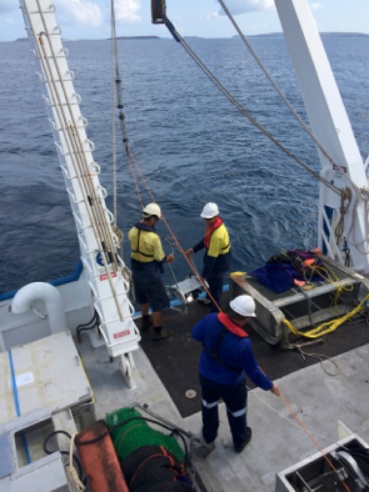
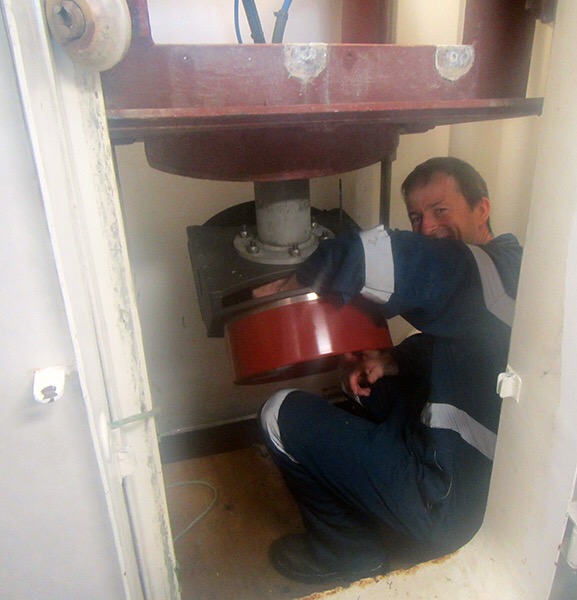
To do this, we are using a large metal frame with a mesh bag attached to it called a sled (see below). The RV Solander crew lower the sled carefully into the water using a strong steel cable until it hits the sea floor. The RV Solander then slowly moves forward for 50 to 100 metres as the sled drags along the sea bottom, collecting sand, mud and critters in the mesh bag. Then the crew then slowly pull up the sled using one of the several heavy duty winches mounted from the upper deck.

RetreavingASledOntheSoander
RV Solander crew carefully raise the sled, secure it on deck, lift the mesh bag over the sorting table, and release the contents

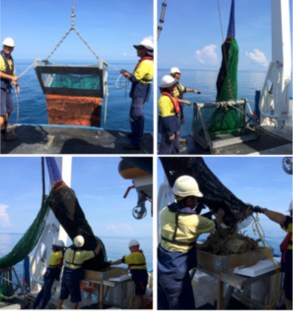
Once the sled is securely anchored to the deck, the crew use the winch to raise the mesh bag above a sorting table and empty the bag.

Sorting sled contents

The next step is to sort everything that came out of the mesh bag into groups based on what kind of animals and plants they are (see below).

SortingSamples
WA Museum and CSIRO scientists sort samples into groups on the back deck of the RV Solander

Measurements, photos and preservation

Samples are then weighed, assigned a unique ID number and bar code and then recorded in a computer database (see below). A series of photos is taken of each specimen with its bar code for later use by scientists on land in the laboratory.

CatalogSamples
WA Museum scientists carefully weigh, catalog and photograph each specimen.

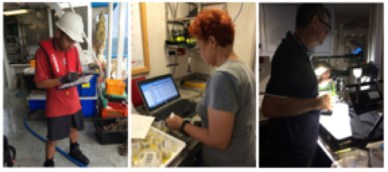
Caption: WA Museum and CSIRO scientists carefully weigh, catalog and photograph each specimen.

Finally, the specimens are then carefully stored in a liquid that keeps them from decaying or are frozen. This keeps them fresh until they can be analysed back on dry land in the lab.
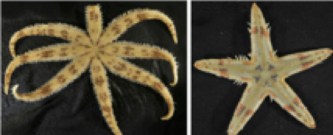
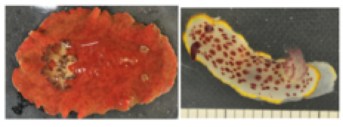
Sample sled hauls

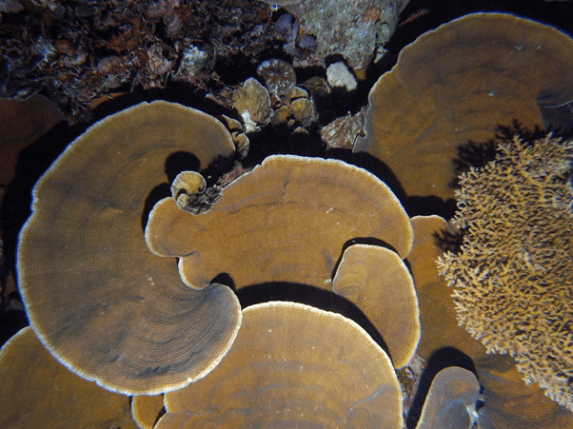
A few examples of the types of creatures we’ve found so far are:

StarFish
Examples of starfish. Most have 5 arms, but some have 8 or more. An arm can regrow if lost to a predator.
CoralCrab
Example of a coral crab.
Nudibranchs
Nudibranchs (sea slugs) eat sponges and leave a ‘slime trail’ where-ever they go to avoid getting lost
SeaCumbers
Sea cucumbers are so named because some people consider them a delicacy. Don’t eat the ones shown here though because they are poisonous!
FeatherStarts
Examples of feather stars. The one on the left is broken and you are seeing the top of it. The one on the right is intact and you are seeing the bottom of it. It has nearly 100 arms!
AssortedCreatures
Examples of creatures collected. Clockwise from top left: sea whips, sponge, sea urchin, soft corals, sponge, sponge.

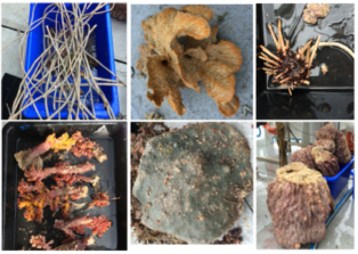
Now that I’ve given you an idea of the ways we are exploring the Bonaparte Archipelago, the rest of my posts will focus on interesting creatures or habitats we find along the way.

MarjiWhips
Sea whips look just like their name.

Thanks for reading – see you next time!


Exploring the sea floor with video


When most people think of marine scientists discovering underwater habitats and creatures, they assume those scientists will be swimming underwater using SCUBA.

But Western Australia’s Kimberly coast has extremely high tides that create treacherous currents that make it too dangerous for divers.Watch a video about how the tides work. Not to mention the tiger sharks   and crocodiles that infest these waters!

CrocAndShark
Salt water crocodiles and sharks make it dangerous to SCUBA dive offshore from northern Western Australia.

Plus, we are interested in parts of the sea floor that are too deep for divers (40-100 metres deep).

How do you see what is on the sea floor when it is too deep or too dangerous for divers?

AIMS have developed a solution – attaching a camera and a video camera protected in waterproof cases to an aluminium sled that can be towed behind the ship using a long strong cable. This is called the tow-vid system (see below). A powerful strobe light illuminates the sea floor for the video.

TowedVideo
RV Solander crew prepare tow-vid


The ship’s powerful winch lifts the tow-vid system into the air and the crew carefully guide it into the water. Note how everyone involved is wearing hard hats, life jackets and steel toed boots!


TowvidWinch
RV Solander crew lower the AIMS tow-vid into the water.

Once the tow-vid is submerged and lowered to the sea floor, the ship slowly moves along a predetermined 1.5 km long transect line at a constant slow speed. The video camera continually records and transmits to a computer on deck.

Watch a sample of what the tow-vid saw today near Augereau Island.

TowvidStills
Examples of still photos from tow-vid on this trip: top = sea cucumber, middle = sponge, bottom = feather star.

Still photos of the sea floor are taken at regular intervals and downloaded once the tow-vid is back on deck. Later, back on land, scientists analyse these to identify the species of animals and plants they contain.

Examples of still photos from tow-vid on this trip are on the left : top = sea cucumber, middle = sponge, bottom = feather star.

While the ship is moving along the tow transect, two scientists are responsible for keeping the tow-vid on track, and recording data as it operates.

First, a tow vid technical expert (in our case, Neill), watches a computer screen which shows live footage from the underwater video camera. He uses this as a guide to change the speed and direction of the tow-vid via the winch so that it doesn’t hit the bottom, and also so that it is close enough to the bottom to be able to see the habitats and creatures there as clearly as possible.

TowVidTec
Tow vid technician Neill steering the tow-vid using the joystick in his hand.


Second, a marine scientist (in our case Marcus) watches the live video footage and regularly clicks a button on the smaller computer screen to record what type of habitat he sees on the sea floor in a computer database. This can be used to create maps of the study area.


CollectingTowedVideo
Live video footage from the towed video as viewed on deck, and Marcus recording what he sees as Neill drives the tow-vid.

Back on dry land, spatial scientists then use this data to map where various habitats were found. The first step is to colour code each location where Marcus made an observation as a point along the track the ship towed the tow-video system.


TowvidWormPlot
An example of ‘Worms’ map

To end for today, below is a map of where we are working today. The red line shows the path followed by the RV Solander. The blue numbers show were we plan to run tow video transects.

TripProgress051205

I hope you are enjoying this blog! Leave a comment and let me know what you think. I will post again in a day or so.

Mapping the sea floor…

Last night we finally arrived at our destination (See where we are) while the sun sank into the Indian Ocean!


Spatial scientist and blogger (Marji) soaking up the serenity.
Now that we’ve arrived, we plan to:

  • Map the sea floor.
  • Examine the habitats and creatures that live there.
  • Measure how much light is in the water, how hot it is, and how salty it is.
  • Measure how much the water level changes with the tides.

In today’s blog, I’ll explain a bit about how we map the sea floor.

You may think that the sea floor is flat, but it can have seamounts (underwater mountains) and canyons and everything in between, just like dry land (see example below).


An example of a 3d map of the ocean floor.
How can we tell what the sea floor is like when it is hidden under 10s to 100s of metres of water?

In the past, ships dropped long ropes with heavy weights on them to measure the distance from the surface to the sea floor.

Today we use sound waves to measure this distance – it is much more cost effective.  This is called sonar (watch a video of how it works).

We attach a high-tech instrument (a multi-beam sonar) underneath the ship (see below).


Installing the multibeam sonar on the RV Solander

It sends sound pulses downward. The time it takes for the sounds to hit the bottom and bounce back to the ship tells us how deep the sea floor is and whether it is made of sand, rock or mud (see picture below).


An example of how sonar works.
We have two scientists on board in charge of our sonar.  Nick operates the sonar and Iain (below) analyses the data to create 3D models of the sea floor.

Sonar data processing in the ‘dry laboratory’ on the RV Solander
For example, here is data from a test run completed on our way to the study area. Blue areas are deepest and red areas are shallowest.


Example of sonar data recorded in a test run.

And here is a map of the route the ship will take (blue lines) through the study area to map the sea floor with sonar. Where possible, we run sonar at night to free up the days for other work.

Sonar survey plan (blue lines). RV Solander shown in red.
In my next post, I’ll explain how we use a towed video system to take photos and record video deep under water.

See you then!

And we’re on our way…

map
Map of our journey along the West Australian coast.

The RV Solander has left Broome (See where we are), steaming northwards to our study area in the Bonaparte Archipelago!

It will take us more than a day and a night (about 30 hours) to get here – Western Australia is bigger than you may think.  The red line on the map above shows you our entire journey.


karen
Cruise Leader Karen en route to the RV Solander

Safety at sea is very important. Our Cruise Leader (Karen) makes sure everyone on board is prepared for the journey ahead. Here she is riding in an a zodiac (small inflatible boat) from the dock  in Broome to the ship.


rob.jpg
Skipper Rob steers the ship

Our Skipper (Rob) makes sure the ship gets us where we need to be safely. Here he is in the wheelhouse, steering the ship.

And we all learn the safety rules of the ship-

liferaft.jpg
All science staff attend the safety induction before we get underway.

including how to use the life raft.

In my next post, I’ll explain some of the ways we plan to explore the study area!

Preparing for the expedition…

Welcome to this blog!

Keep checking to see the latest discoveries and adventures of an expedition of discovery to the seas around the islands of the Bonaparte Archipelago located offshore roughly halfway between Darwin and Broome.

The Western Australian Marine Science Institution (WAMSI) is sending scientists from:

to learn more about the coral reefs, sponges, and other creatures that live in this little studied region of Western Australia’s amazing coastline.

As the scientists and crew of the AIMS research vessel the RV Solander get ready to set sail on 2 December 2015, you can learn more about the research vessel that will transport them to this very remote region in the Indian Ocean.

Well before the journey begins, scientists think carefully about what they want to try to discover and where they should look.  Travelling by boat is expensive and it is not possible to visit every single place where important and interesting habitats and sea creatures might live.

The next blog entry will explain what we hope to discover and why, and how we will do so!  See you then.


Hawaii experiences its most severe recorded coral bleaching event

Coral bleaching, in Kaneohe Bay near Kaneohe, Hawaii. Photograph: Dan Dennison/AP (source http://www.theguardian.com/us-news/2015/sep/13/hawaii-coral-bleaching-scientists-predict-worst-ever).

Hawaii is experiencing some abnormally warm ocean temperatures causing extensive coral bleaching which is most likely the worst bleaching event recorded.

When corals bleach they expel there symbiotic algae which they rely on for nutrient and loose there colour. If temperatures don’t drop down to normal levels after several weeks this leads to coral death due to thermal stress and nutritional depletion.

Researchers from the Hawaii institute of Marine Biology indicated that most corals recovered from a milder bleaching event last year but this year’s event where water temperature is has been elevated for extended periods by as much as 3 degrees above the normal summer range has resulted in  severe bleaching and  significant coral death.

Sources (http://www.theguardian.com/us-news/2015/sep/13/hawaii-coral-bleaching-scientists-predict-worst-ever http://coralreefwatch.noaa.gov/satellite/analyses_guidance/enso_bleaching_97-99_ag_20140507.php)

February-May 2016: An extended bleaching outlook showing the threat of bleaching expected in Kiribati, Galapagos Islands, the South Pacific, especially east of the dateline and perhaps affecting Polynesia, and most coral reef regions in the Indian Ocean. (Credit: NOAA http://coralreefwatch.noaa.gov/satellite/analyses_guidance/enso_bleaching_97-99_ag_20140507.php)

Seeking coral spawn at Scott Reef in the Timor Sea

A tenuis crop

Mass spawning of corals occurs annually on reefs worldwide, usually between spring and autumn, in tune with seasonal cycles of water temperature and sunlight. This extraordinary natural event remained part of the secret lives of corals until the early 1980s when scientists began to spend time underwater after dark on the Great Barrier Reef and to their astonishment observed more that 100 coral species spawning. Subsequently careful observations after dark by researchers and enthusiast divers has resulted in coral spawning being documented throughout the tropics, including at Scott Reef, where spawning was first recorded in 1995.

The timing of spawning is usually fine tuned around the lunar cycle and researchers have become accustomed to predicting spawning times based on particular months of each year and certain days of the lunar cycle. In Australia, on the Great Barrier Reef, the main spawning season occurs after full moons between October and December, with November the peak month when the many corals spawn on mid-shelf and offshore reefs. Key nights have proven to be 4-6 nights after the full moon, around the time of neap tides. At Scott Reef a subset of species also spawn during October and November, but the major spawning season fall between February and April. Corals on the western side of Australia are mostly likely to spawn following the March full moon, but 8-10 nights later when, once again the tides are entering their neap phase.

The worldwide observations of coral spawning have stemmed from plenty of time watching out for spawning at night, but researchers have also used some clues to fast track the discovery when seeking to work out spawning times at a new location. Detailed studies of tissue samples collected form coral colonies each month throughout the year have revealed that the corals take several months to grow their gametes prior to each spawning event. Each month the average egg size increases until the final size typical for each species is reached. Commonly mature coral eggs are 350-600 um diameter, making them visible to the naked eye if you break a coral open. Throughout this development immature coral eggs are usually white, but in their final month of maturation they can become coloured, with pastel pinks, oranges and reds the typical hues, but white, blue and green sometimes seen. The size and pigmentation of mature eggs provides researchers with a rapid guide to which species are ready to spawn during any particular month. Divers can check a few corals by cutting a small fragment and looking inside for evidence of the coloured eggs that signifies they are waiting to be released. This sort of pre-spawn check can really help when first studying a new location, but the second aspect of coral biology that helps predicting key spawning months is the synchrony within and often between species. Each coral colony that spawns its gametes into the sea is likely to achieve successful fertilisation with gametes from the same species if they release their gametes at the same time. Consequently there is a very high degree of spawning synchrony between colonies of individual species, with gametes usually being shed into the water within minutes of each other. Furthermore, as the seasonal and monthly cues that regulate the timing of spawning are common to all corals on a reef, it is normal for more than one species to spawn during the key nights each year. Although each species may have a particular time after dark for spawning. As a result, once a spawning month has been determined for one species it provides the focal point for when other species could be spawning at the same location. If many species spawn they can also provide a further cue in the form of a strong smell coming off the water and the next morning the presence of pink slicks of coral eggs and embryos floating on the sea.

These discoveries of coral spawning around the world have nearly all involved shallow water reefs where corals are easily accessible, marine labs or aquariums may be nearby for the study of live specimens and divers can spend time in the sea at night to make direct observations.  However, nobody is sure what happens in deeper water coral communities, living below 30m where scientific divers rarely spend much time corals living in this deeper twilight zone, known as the mesophotic due to the modest to very low levels of light available, are poorly studied but increasing recognised as important  parts of reef ecosystems worldwide. They are very abundant in the deeper lagoon at South Scott Reef.  A few samples collected using a grab during past research have indicated that some species had pale but pigmented eggs at the same time of year as the shallow species were spawning, but nothing definitive could be determined.

This month divers aboard the AIMS research ship RV Solander have been looking at the shallow corals and providing information to the team on Falkor. While it looks like the main spawning may have occurred following the March full moon, around 20% of the shallow water corals look like they’ll spawn during Falkor’s visit. The Falkor has sophisticated positioning equipment and an ROV fitted with high definition cameras. The Falkor’s presence at Scott Reef during a potential shallow water coral spawning event provides a rare opportunity to study the mesophotic corals and hopefully catch the first ever observations of them spawning  on the nights of 12-13 April.

 DeepWaterCoralsAtScott

Mesophotic corals in 52m water depth at Scott Reef during preliminary observations using the Falkor’s ROV.

MesophoticCoralsat52Meters

A downward looking view of mesophotic corals  in 40-50m depths at Scott Reef

CoralEggs

Mesophotic branching Acropora coral showing pale pink mature eggs in March  from a sample collected at 51m depth using a grab in 2013

CoralSlick

A coral spawn slick containing millions of coral embryos on the sea surface the morning after a massive shallow water spawning event at Scott Reef (photo James Gilmour, AIMS)

About the North West Atlas blog site.

The North West Atlas was created in response to the need for more comprehensive and accessible information on environmental and socio-economic data on the greater North West region.  As such, the North West Atlas is a web portal to not only access and share information, but to celebrate and promote the biodiversity, heritage, value, and way of life of the greater North West region.

To achieve these goals, the North West Atlas provides the infrastructure and tools to promote the free and open exchange of information to support science, policy making and public understanding of the greater North West region.

The North West Atlas project builds on the e-Atlas project for the Great Barrier Reef and the Ningaloo Atlas covering Ningaloo World Heritage Area.  It is a partnership between government organisations, non-government organisations, researchers, industry, and community groups to improve our understanding and raise awareness of the greater North West region.

Funding for the North West Atlas project has been provided by PTTEP Australasia (a wholly-owned subsidiary of PTTEP, the Thai national petroleum exploration and production company) and the Australian Institute of Marine Science (AIMS).

The North West Atlas Blog forms part of the North West Atlas communication strategy to share information on the greater region to a wider audience.   Please feel free to contact at any time should you have any comments/suggestions for this Blog or the Ningaloo Atlas, or whether you would like to share anything on this Blog site that is related to the Ningaloo Coast.  We look forward to hearing from and sharing information with you.